
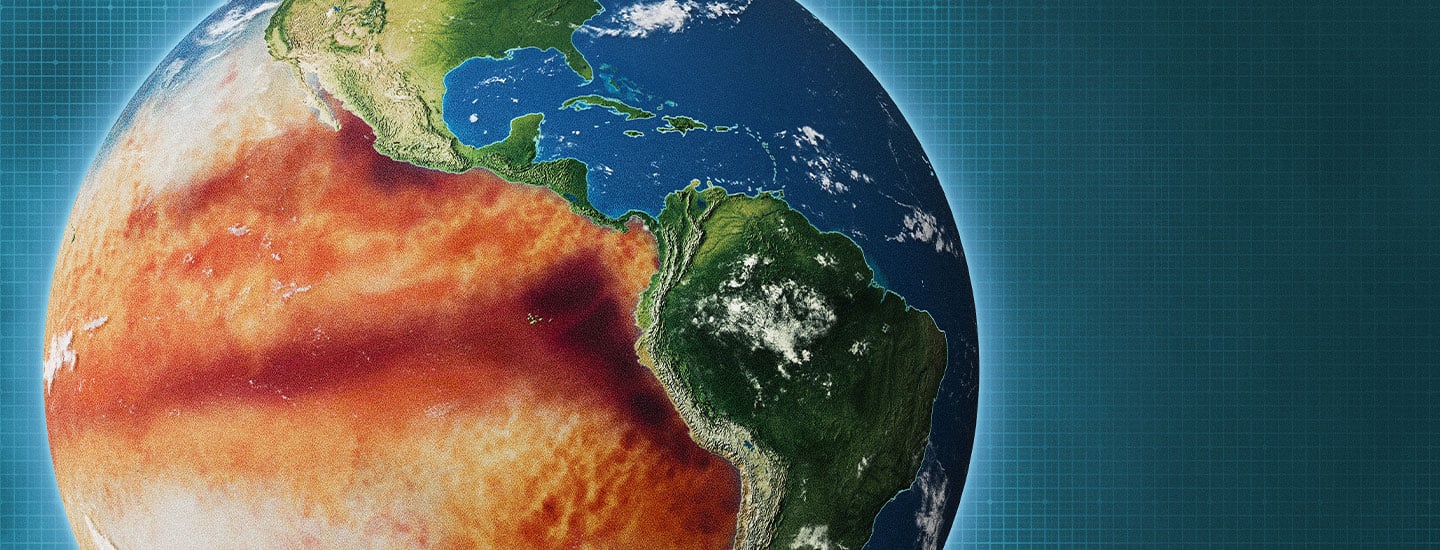

A map shows the globe with the Americas & a band of red & orange warm water across the Pacific

HEATING UP

This map shows warmer-than-average water in the eastern Pacific Ocean in mid-2026, signaling the development of El Niño conditions. Darker red-orange indicates higher water temperature.

ILLUSTRATION BY MAGICTORCH

Standards

El Niño, Explained

June 2026 saw the arrival of El Niño, a climate pattern that occurs when waters in the Pacific Ocean heat up more than usual. This year’s El Niño could be especially strong. What does that mean for us?

What is El Niño?
Learn about the weather pattern called El Niño.

WHAT IS EL NIÑO?

You may have seen recent news stories or social media posts announcing “El Niño has arrived!” But what exactly is El Niño? El Niño is a set of climate conditions that occurs every few years when surface waters in the Pacific Ocean near the equator heat up more than usual and shift toward the east.

A temperature change in the ocean may not sound like a big deal, but it has major consequences for weather around the world. In many regions, El Niño can contribute to devastating natural disasters, such as flooding, wildfires, and drought. Meteorologists have seen signs that El Niño may be particularly strong this fall and winter.

News stories and social media posts are announcing, “El Niño has arrived!” But what is it? El Niño is a set of climate conditions that occurs every few years. Surface waters in the Pacific Ocean near the equator heat up more than usual. This warm water shifts toward the east.

A temperature change in the ocean may not sound like a big deal. But it has major effects on weather around the world. In many places, El Niño can contribute to deadly natural disasters. They include flooding, wildfires, and drought. Meteorologists warn that El Niño may be especially strong this fall and winter.

WHAT HAPPENS DURING AN EL NIÑO?

No two El Niños are exactly alike, but some patterns have emerged. Certain areas that typically receive a lot of rain—like Indonesia and northern Australia—may become drier during El Niño. This increases the risk of wildfires and drought there. Drought often affects southern Africa as well. Some normally dry areas, like parts of Peru and Ecuador, can see record rainfalls. In the U.S., El Niño often brings wetter weather to parts of the West Coast and South, while winter may be milder in some Northern states.

This year could bring a “super” El Niño (though this is not an official term). Climatologists categorize El Niños by how much the Pacific warms. Warming of 2°C (3.6°F) indicates a very strong El Niño, making impacts like drought and flooding more likely, says climatologist Emily Becker of the University of Miami.

No two El Niños are exactly alike, but some patterns have appeared. Areas like Indonesia and northern Australia usually receive a lot of rain. But during El Niño, they may become drier. This increases their risk of wildfires and drought. Often, drought also affects southern Africa. But some normally dry regions can have record rainfalls. That includes parts of Peru and Ecuador. In the U.S., parts of the West Coast and South are often wetter during El Niño. And winter may be milder in some Northern states.

This year could bring a “super” El Niño. (But that’s not an official term.) Climatologists describe El Niños by how much the Pacific warms. A very strong El Niño results from warming of 2°C (3.6°F). Then effects like drought and flooding are more likely, says Emily Becker. She’s a climatologist at the University of Miami.

Ocean warming of 2°C or more indicates a very strong El Niño.

HOW DID SCIENTISTS LEARN ABOUT THIS PHENOMENON?

The earliest records of El Niño come from Peru in the late 1800s. Fishers along the country’s western coast noticed that “every so often, they received periods of intense rainfall, ocean currents changed, the water became warmer, and they caught different fish species,” says George Adamson. He’s a geographer and climate historian at Kings College London in England. Because these changes showed up in winter, Peruvians named the phenomenon El Niño, which means “the boy” in Spanish—a reference to baby Jesus, whose birth is celebrated by Christians in December.

In the 1920s, devastating El Niño flooding in Peru captured international attention. Around the same time, British mathematician Gilbert Walker was trying to forecast seasonal rains in India, which are critical for crop production. Using global weather records, Walker and the Indian clerks working with him “crunched huge amounts of data,” says Adamson. Those calculations uncovered a relationship between measurements of atmospheric pressure—the force of air pressing down on an area—on opposite sides of the Pacific Ocean. When pressure rose on one side, it dropped in the other. Walker named this atmospheric seesaw the Southern Oscillation.

In the 1950s and 1960s, research expeditions measured unusually warm waters in the Pacific during El Niño years. In the late 1960s, meteorologist Jacob Bjerknes at the University of California Los Angeles realized that the atmospheric pattern Walker had discovered was connected to the heavy rains in Peru and ocean temperature changes. They were all part of the same cycle. “Bjerknes put them together into the model that’s widely accepted today,” says Adamson. The cycle is now known as El Niño-Southern Oscillation (ENSO) and lasts two to seven years.

The earliest records of El Niño come from the late 1800s. Fishers along Peru’s western coast saw a pattern. They noticed that “every so often, they received periods of intense rainfall, ocean currents changed, the water became warmer, and they caught different fish species,” says George Adamson. He’s a geographer and climate historian at Kings College London in England. Because these changes appeared in winter, Peruvians named them El Niño. That means “the boy” in Spanish. It refers to baby Jesus, because Christians celebrate his birth in December.

In the 1920s, El Niño caused terrible flooding in Peru. It captured global attention. Around that time, British mathematician Gilbert Walker was trying to forecast seasonal rains in India. These rains are important for crop production. He and a team of Indian clerks used global weather records and “crunched huge amounts of data,” says Adamson. This included measurements of atmospheric pressure, or the force of air pressing down on an area. They discovered a connection on opposite sides of the Pacific Ocean. When pressure rose on one side, it dropped in the other. It was like an atmospheric seesaw. Walker named it the Southern Oscillation.

In the 1950s and 1960s, research expeditions collected data. They measured unusually warm waters in the Pacific during El Niño years. In the late 1960s, Jacob Bjerknes put the pieces together. He was a meteorologist at the University of California Los Angeles. Bjerknes realized that Walker’s atmospheric pattern was connected to the heavy rains in Peru and ocean temperature changes. They were all part of the same cycle. “Bjerknes put them together into the model that’s widely accepted today,” says Adamson. The cycle is now known as El Niño-Southern Oscillation (ENSO). It lasts two to seven years.

WHAT CAUSES EL NIÑO?

El Niño starts with a disruption in the trade winds, which normally blow westward along the equator. In a typical year, these winds push the Pacific Ocean’s warm surface waters west. “It’s like a giant hair dryer blowing across a bathtub,” says Adamson, causing warm water to pile up at one end.

During El Niño, trade winds weaken. Scientists are still studying why, but it’s like the hair dryer switches off, explains Adamson. Then “the warm water piled up in the western Pacific flows east,” he says. El Niño officially arrives when water temperatures in the eastern Pacific remain 0.5°C (0.9°F) above average for several months.

El Niño starts with a change in the trade winds. Normally, these winds blow westward along the equator. They usually push the Pacific Ocean’s warm surface waters west. “It’s like a giant hair dryer blowing across a bathtub,” says Adamson. This causes warm water to pile up at one end.

During El Niño, trade winds weaken. Scientists are still studying why. It’s like the hair dryer switches off, explains Adamson. Then “the warm water piled up in the western Pacific flows east,” he says. Water temperatures in the eastern Pacific rise. When they remain 0.5°C (0.9°F) above average for several months, El Niño is officially here.

El Niño changes where storms and hurricanes happen.

HOW DOES EL NIÑO AFFECT THE WEATHER?

Warm water heats the air above it. As warm air rises and cools, the water vapor it contains condenses into storm clouds. Warmth shifting to a different location alters where storms form and precipitation falls, “sending ripple effects around the globe,” explains Becker. “It changes where rain and snow and hurricanes happen,” she adds.

Warm water heats the air above it. Then the warm air rises and cools. The water vapor in the air condenses into storm clouds. During El Niño, warmth moves to a different location. This alters where storms form and precipitation falls, “sending ripple effects around the globe,” explains Becker. “It changes where rain and snow and hurricanes happen.”

© WOODS HOLE OCEANOGRAPHIC INSTITUTION

TRACKING AT SEA: Buoys like this one help climatologists monitor the conditions that lead to El Niño.

IS IT POSSIBLE TO PREDICT EL NIÑO?

After a strong El Niño in the 1980s took meteorologists by surprise, the U.S. invested in buoys and satellites to monitor Pacific conditions and detect El Niños forming. In the 1990s, data from that monitoring network revealed a kind of opposite to El Niño—when trade winds strengthen, pushing warm water farther west, leaving the eastern Pacific cooler than usual. It’s known as La Niña, Spanish for “the girl” (see Temperature Swings). Today ENSO forecasts can give officials months to prepare for the impacts of El Niño and La Niña.

In the 1980s, a strong El Niño took meteorologists by surprise. So the U.S. invested in buoys and satellites to monitor Pacific conditions. Now scientists can detect El Niños forming. In the 1990s, this network revealed a kind of opposite to El Niño. It happens when trade winds strengthen and push warm water farther west. Then the eastern Pacific is cooler than usual. This climate pattern is called La Niña, Spanish for “the girl” (see Temperature Swings). El Niño and La Niña both affect weather. Today ENSO forecasts can give officials months to prepare.

HOW DOES EL NIÑO RELATE TO CLIMATE CHANGE?

El Niño is a climate pattern that goes back many thousands or perhaps even millions of years. But this natural cycle now takes place against the background of rapid climate change caused by human activity over the past 150 years or so. The burning of fossil fuels pushes average global temperatures higher and higher, contributing to stronger El Niños in recent decades. “The natural El Niño climate fluctuation is mapped onto the moving baseline of anthropogenic [human-caused] climate change,” says Adamson. Combined with ongoing climate change, the release of extra heat from the Pacific during this year’s El Niño could bring widespread record-breaking fall and winter temperatures.

El Niño is a natural climate pattern. It goes back many thousands or perhaps even millions of years. But it now takes place along with rapid climate change. This change is caused by human activity over the past 150 years or so. The burning of fossil fuels pushes average global temperatures higher and higher. In recent decades, this has contributed to stronger El Niños. “The natural El Niño climate fluctuation is mapped onto the moving baseline of anthropogenic [human-caused] climate change,” says Adamson. On top of climate change, this year’s El Niño will release extra heat from the Pacific. That combination could bring widespread record-breaking fall and winter temperatures.

COMMUNICATING INFORMATION: How do changes in ocean temperature affect where storms form?

videos (1)
Skills Sheets (3)
Skills Sheets (3)
Skills Sheets (3)
Quizzes (1)
Lesson Plan (2)
Lesson Plan (2)
Quizzes (1)
Text-to-Speech